In Germany we have the following saying: Everything has already been said – but not yet by everyone. For what it's worth, in what follows I take my own turn and try to explain the concept of statistical power using simple words, simulations of data, and some gifs.
Note that this post is written primarily for students in order to provide some guidelines for empirical theses or reports. I provide the R-code necessary for the analyses, and you can also download everything from my github.

Why should I care about power?
Power is an extremely relevant statistical concept. It is hard to underestimate the importance of studies being well-powered. I would say that when assessing the quality of an empirical study, having adequate power is one of the most crucial aspects.
If you think that this is an exaggeration or if you feel like running power analyses is a nuisance, another one of those pesky concepts that nerdy statisticians force you to implement, I would reply the following:
You haven't fully understood power yet.

At least that was the way I felt. Once it really clicked with me, it became an absolute no-brainer that running a priori power analyses to determine adequate sample size is, above all, in my very own interest.
What is power?
In short, it describes the probabilility of being able to cry “Eureka! I found it!”, when in fact there was something that could be found. In other words, if there is an effect, how often will you find it in the long run? 1
More specifically, the power of a study can be calculated once you know:
- What test you want to run (say, a correlation or an ANOVA)
- What effect you want to be able to find (e.g., r = .1, d = .2)
- The probability of committing an alpha error (the convention is 5%. Pros, however, justify their choice of alpha specifically for each study depending on what is at stake; Lakens et al., 2017)
- The number of observations you have collected (e.g., n = 200)
But calculations are one thing. What is even more illustrative are simulations. I think I only really started to understand power once I had seen some tutorials with simulations of actual data. 2
The main advantage of simulating your own data is that you can actually specify the true effect in the population. So, by definition, you know what result your study should reveal.

To make things more palpable, let us create some data for a typical research question from my own field, media psychology.
Does the privacy paradox exist in Hohenheim?
I personally am interested in the so-called privacy paradox, which states that the privacy concerns of people are unrelated to their actual information sharing behavior (e.g., Barnes, 2006).
I think it is safe to say that the privacy paradox has been refuted by and large (e.g., Dienlin & Metzger, 2016). For example, a recent meta-analysis found that privacy concerns and information sharing exhibit a relation of r = -.13 (Baruh et al., 2017). Hence, if people are more concerned, they are (slighty) less willing to share information.
Let's imagine we want to find out whether the privacy paradox exists among the students in Hohenheim. Let's create some data!

Data simulation
Currently, 10,000 students (our population) are enrolled at Hohenheim. Building on Baruh et al. (2017), we define the actual correlation between privacy concerns and information sharing to be r = -.13. 3
# load packages
library(ggplot2); library(magick); library(pwr); library(tidyverse)

# set seed; necessary for reproducing the analyses
set.seed(170819)

# define population size
n_pop <- 10000

# define effect size of interest
r_pop <- - .13

# define alpha level
alpha_crit <- .05

# simulate values for privacy concerns
priv_con <- rnorm(n = n_pop, mean = 0, sd = 1)

# simulate values for information sharing that are related to privacy concerns
inf_sha <- r_pop * priv_con + rnorm(n = n_pop, mean = 0, sd = 1)

# save as data.frame
d <- data.frame(priv_con, inf_sha)
Let's first check whether the simulation worked.
cor.test(d$priv_con, d$inf_sha, method = "pearson")
##
##  Pearson's product-moment correlation
##
## data:  d$priv_con and d$inf_sha
## t = -10, df = 10000, p-value <2e-16
## alternative hypothesis: true correlation is not equal to 0
## 95 percent confidence interval:
##  -0.15 -0.12
## sample estimates:
##   cor
## -0.13
Yes indeed, in our population we have a correlation of r = -.13.
Run study
Now, let's imagine we are running a study to find out whether the privacy paradox exists. Because we cannot ask all 10,000 students, we are going to collect a sample.
How many? Good question. 200 seems quite a lot – that should do the job, right? So from the population, we will now draw a sample of 200 students and estimate the correlation. Will we find an effect … ?
# define sample size
n_sample <- 200

# randomly define participants who are going to be selected for the study
id_sample <- sample(nrow(d), n_sample)

# create dataframe of subsample
d_sample <- d[id_sample, ]

# calculate correlation
results_complete <- cor.test(d_sample$priv_con,
                                d_sample$inf_sha,
                                method = "pearson")
print(results_complete)
##
##  Pearson's product-moment correlation
##
## data:  d_sample$priv_con and d_sample$inf_sha
## t = -1, df = 200, p-value = 0.2
## alternative hypothesis: true correlation is not equal to 0
## 95 percent confidence interval:
##  -0.231  0.044
## sample estimates:
##    cor
## -0.095
We find a correlation of r = -0.1 and a p-value of p = 0.18. Hence, our result is not significant. Bummer!

On the basis of the results we could therefore not reject the privacy paradox. We would even feel tempted to conclude that indeed, the behavior of people seems to be somewhat paradoxical. 4
However, remember that in the population there is an actual effect! So what went wrong? Bad luck? To find out, let us run another study. Again, we draw a random sample of 200 students from our population. Maybe this time we get lucky?
# define participants who we are going to be selected for the subsample
sample <- sample(nrow(d), n_sample)

# create dataframe of subsample
d_sample <- d[sample, ]

# calculate correlation
results_complete <- cor.test(d_sample$priv_con,
                             d_sample$inf_sha,
                             method = "pearson")
print(results_complete)
##
##  Pearson's product-moment correlation
##
## data:  d_sample$priv_con and d_sample$inf_sha
## t = -3, df = 200, p-value = 0.01
## alternative hypothesis: true correlation is not equal to 0
## 95 percent confidence interval:
##  -0.308 -0.039
## sample estimates:
##   cor
## -0.18
Indeed, we find a correlation of r = -0.18 and a p-value of p = 0.01, which is significant. Drawing another sample (with the same sample size) thus gave us a positive result. Hooray!

If we now repeated this procedure a hundred times, this is what we would get:
# number of studies to be run
n_studies <- 100

# initialize object
results <- data.frame(study = 0, r = 0, p = 0, significant = TRUE)

# run simulation
for(i in 1:n_studies) {
  study_no <- i
  sample <- sample(nrow(d), n_sample)
  d_sample <- d[sample, ]
  results_complete <- cor.test(d_sample$priv_con,
                               d_sample$inf_sha,
                               method = "pearson")
  results[study_no, ] <- data.frame(study_no,
                                    results_complete$estimate,
                                    results_complete$p.value,
                                    ifelse(results_complete$p.value < .05, TRUE, FALSE))

  # plot results
  p <- ggplot(select(results, -p), aes(x = study, y = r, color = significant), frame = study) +
    geom_point() +
    theme_bw() +
    xlim(0, n_studies) +
    ylim(-.3, .1)
  ggsave(paste0("figures/figure_", sprintf("%03d", study_no), ".png"), dpi = "print", width = 5, height = 5)
}

# create gif
system2("magick",
        c("convert", "-delay 30", "figures/*.png",
          "figures/power_50_animated.gif"))

# remove individual pngs
file.remove(paste0("figures/", list.files(path = "figures/", pattern=".png")))
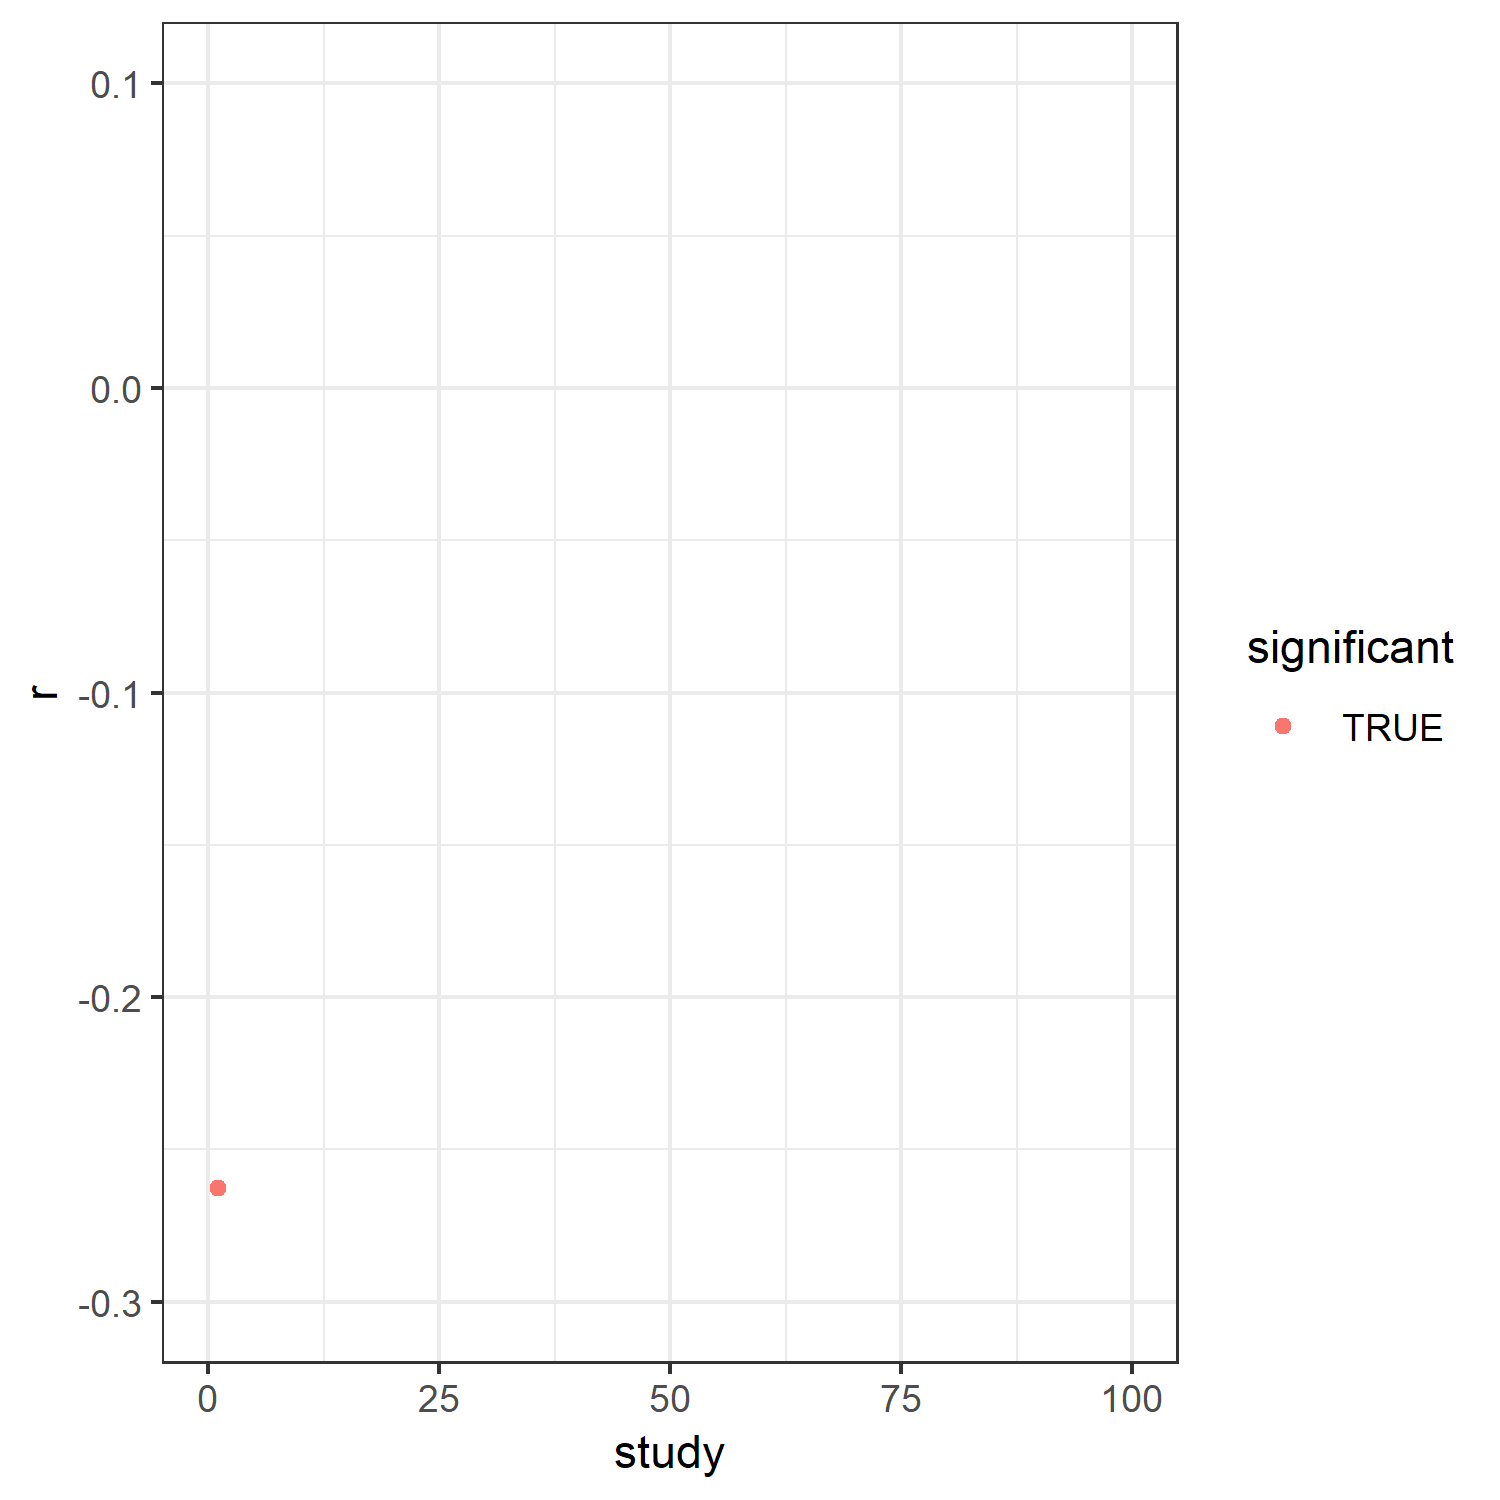
What do we see? On the x-axis, you see the number of each study (1 – 100). The y-axis shows the effect size we found for each study. The blue dots represent significant effects, the red dots represent nonsignificant ones.
What does this mean? Sometimes we get significant effects, sometimes we don't. But given that the relation actually does exist in the population, that is bad. How often have we been right?
mean(results$significant)
## [1] 0.47
In 47 cases. In other words, we only had a 47% probability, that is power, of finding the effect.
Instead of counting simulated data beans, it is also possible to calculate the achieved power statistically. For this you can use the r package pwr.
5
power <- pwr.r.test(n = n_sample, r = -.13, sig.level = .05)
print(power)
##
##      approximate correlation power calculation (arctangh transformation)
##
##               n = 200
##               r = 0.13
##       sig.level = 0.05
##           power = 0.45
##     alternative = two.sided
As you can see, we get a very similar result: the power is 45.19 %. But before we continue, let us step back for a minute, it is important to understand what all of this means.

If we want to analyze the privacy paradox, we would more often than not claim that there is no effect, that the privacy paradox might exist, when in fact it does not. In other words, with 200 people we simply cannot analyze the privacy paradox! Our study would not be informative, it would not add anything to our understanding of the theoretical problem.
Of course this does not only pertain to the privacy paradox. It is valid for all research questions where you would expect a similar-sized, small effect (here, r = .13), and which is analyzed on the basis of a small sample. Hence, if you read a paper where you think “hmmm, this effect should most likely be small … ” and the study includes, say, 200 observations, you can stop reading at that point.

How much power, how many observations?
So what level of power is ideal? Now, remember that in our example the effect actually does exist. So of course we want our study to have a very good chance of finding that effect – otherwise we would be wasting important resources, while risking to come up with false theoretical conclusions. Therefore, in most scenarios it is safe to say that the more power the better.
How much exactly? People often quote Cohen (1992) and state that studies should have a power of 80%. Maybe it is just me, but I think that is still too risky. If the probability of finding something that actually exists is 80%, I think I would rather invest more resources and recruit additional participants to make the study more informative. In most cases I would feel much more comfortable with a probability of 95%. 6

But how many participants would we need in order to attain that probability? Again, we can estimate that using the package pwr.
power_req <- .95
power <- pwr.r.test(r = r_pop, sig.level = alpha_crit, power = power_req)
print(power)
##
##      approximate correlation power calculation (arctangh transformation)
##
##               n = 762
##               r = 0.13
##       sig.level = 0.05
##           power = 0.95
##     alternative = two.sided
As we can see, in order to have a 95% chance of getting a significant result, we would need to ask 762 people.
So let's go back to our simulated data to see whether that really works!
# define sample size
n_sample <- power$n

# initialize object
results <- data.frame(study = 0, r = 0, p = 0, significant = TRUE)

# run simulation
for(i in 1:n_studies) {
  study_no <- i
  sample <- sample(nrow(d), n_sample)
  d_sample <- d[sample, ]
  results_complete <- cor.test(d_sample$priv_con,
                               d_sample$inf_sha,
                               method = "pearson")
  results[study_no, ] <- data.frame(study_no,
                                    results_complete$estimate,
                                    results_complete$p.value,
                                    ifelse(results_complete$p.value < .05, TRUE, FALSE))

  # plot results
  p <- ggplot(select(results, -p), aes(x = study, y = r, color = significant), frame = study) +
    geom_point() +
    theme_bw() +
    xlim(0, n_studies) +
    ylim(-.3, .1)
  ggsave(paste0("figures/figure_", sprintf("%03d", study_no), ".png"), dpi = "print", width = 5, height = 5)
}

# create gif
system2("magick",
        c("convert", "-delay 30", "figures/*.png",
          "figures/power_95_animated.gif"))

# remove individual pngs
file.remove(paste0("figures/", list.files(path = "figures/", pattern=".png")))
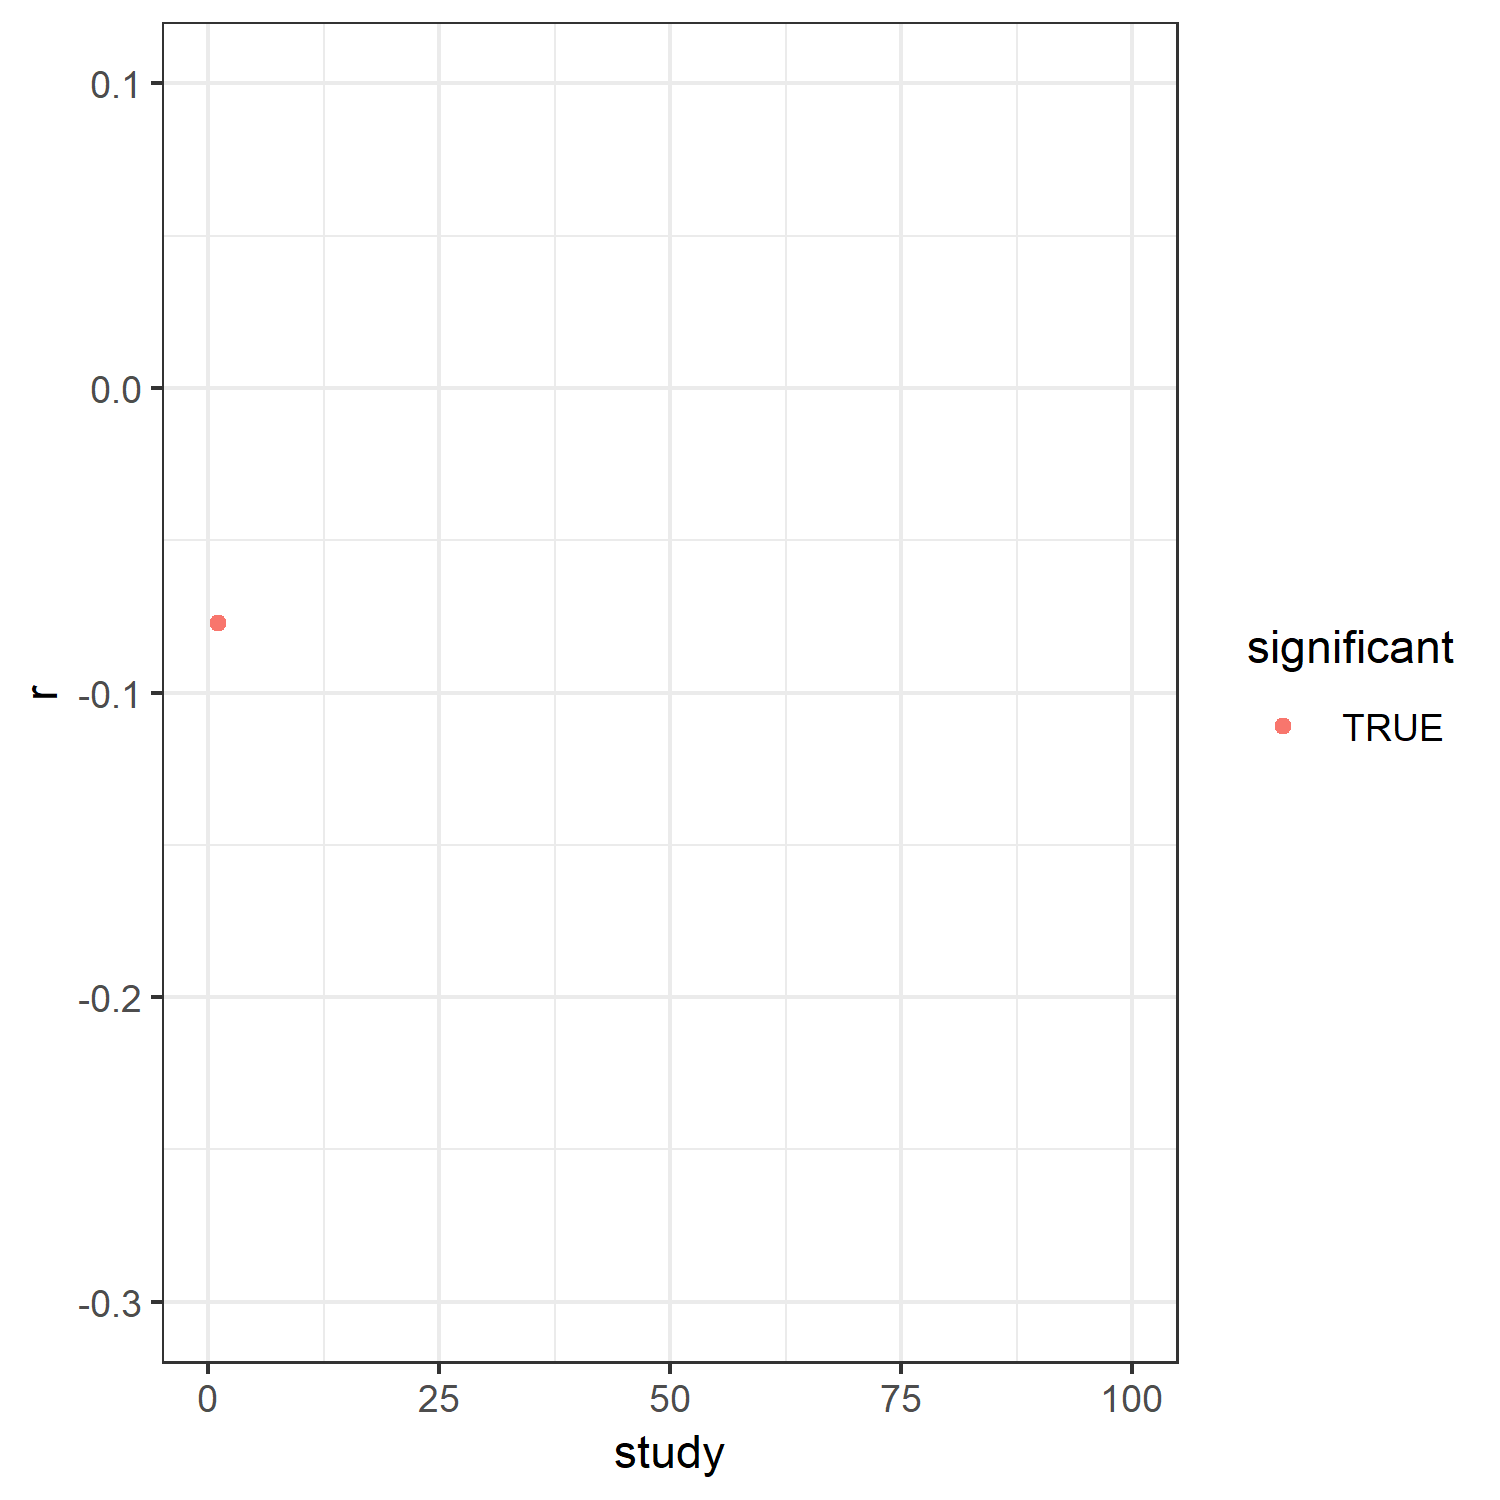
Indeed, it does! With our larger sample of 762 participants, we found a significant effect in 94 cases. In other words, we had a 94% probability (power) of finding the effect!

There are additional benefits of conducting well-powered studies. Just to mention one, effect sizes become more accurate. Put differently, small samples produce artificially inflated effect sizes (Button et al., 2013) – which can be seen when comparing the two gifs.
Before we wrap up, let us briefly address another important concept.
Smallest effect size of interest
When trying to convince some colleagues of the necessity to run power analyses, I have often heard the following response:
“I'd like to, but there is no meta-analysis for my research question that suggests the actual effect size – so it's not possible to run meaningful a priori power analyses”.
First off, if you have absolutely no idea about what effect size to expect, you could at least refer to the general effect sizes that are typically found in your field. In communication science, for example, Rains, Levine, & Weber (2018) reported in a recent meta-review that “Most effect size estimates reported in communication research are small or small-to-medium following Cohen's (1988) benchmarks.” (p. 118). Specifically, the median effect size was r = .18.
However, instead of basing your power analysis on a meta-analysis/meta-review (whose effect is likely to be inflated anyway), it is much more useful to determine a so-called smallest effect size of interest (SESOI) (e.g., Lakens et al., 2018). In other words, you want to define an effect size that you think is already large enough to qualify as support for your theoretical assumption.

But how do you determine a SESOI? Full disclosure: It is very difficult. But as a first (!) step, you could for example say that your effect should be at least small according to the conventions of Cohen (1992) – for example, r = .10. More preferably, however, you would set a real-life criterion using unstandardized effects (but that is a different issue I address in another post that will be published soon). You would then use this SESOI for your power calculations.
In addition, setting a SESOI is crucial because p-values alone do not suffice as claim for your theory. If your effect is trivial, small p-values cannot compensate. So it is always both: finding significance in order to determine the data's surprisingness, and evaluating effect sizes in order to gauge the effect's relevance.
Now what does this mean for our research, and especially for bachelor and master theses … ?
Implications
Above all, we want to run well-powered studies. For research questions where we need to expect small effect sizes this means that we have to collect a large number of observations. In other words, some research questions simply require a ton of resources.
But what do we do if we have little resources? Fortunately, there are several valid options:
1. Look for already existing large-scale data sets
By now, there is a myriad of publicly available large-scale open datasets. Several of these include items designed by social scientists and allow us to conduct high quality analyses of topical questions. I have compiled a list in this blog-post.
2. Use a different design that allows for the collection of more observations
Not the number of participants is the decisive factor, but the number of observations. Often it is possible to run within-person designs, which allow for more observations and are more efficient (e.g., Gelman, 2017).
3. Team up with others
Researchers routinely cooperate so they are able to collect sufficient observations. Most prominently, in psychology there is the so-called Psychological Science Accelerator or the StudySwap initiative, which pools the resources of several labs in order to carry out large-scale studies. In addition, an increasing number of researchers run so-called multi-site studies (without artificially focusing on cultural aspects). Also in BA, MA or PhD theses it is highly advisable to join forces and to collect data together. Just because your advisor collected the data himself/herself, it does not mean that you have to do so as well.
4. Adapt your research questions
It might sound depressing, but sometimes there is no way around adapting or altogether dismissing your research question. For example, if you are interested in priming effects induced by the subtlest of changes to your stimuli, then you either need a ton of resources or a different research question. There is no inherent prerogative to analyze a specific research question – some are not feasible. But fortunately there are remedies: For instance, it is often possible to use stimuli that are more salient, adopt a different research paradigm, or change general variables in favor of more specific ones – all of these mechanisms can increase your power.
Conclusion
Power is extremely important. The empirical results of low-powered studies – however well-designed and theoretically fine-tuned – do not add anything to the literature. To determine adequate sample size it is crucial to run a-priori power analyses, preferably based on a smallest effect size of interest. There are several different options we can choose from in order to achieve studies with adequate power. During this process, some customs and cultures might need to change, yes, but:
Be the change you want to see. No reason to fret, we can do it.

References
- Barnes, S. B. (2006). A privacy paradox: Social networking in the United States. First Monday, 11(9). Retrieved from www.firstmonday.org/issues/issue11_9/barnes/index.html
- Baruh, L., Secinti, E., & Cemalcilar, Z. (2017). Online privacy concerns and privacy management: A meta-analytical review. Journal of Communication, 67(1), 26–53. https://doi.org/10.1111/jcom.12276
- Button, K. S., Ioannidis, J. P. A., Mokrysz, C., Nosek, B. A., Flint, J., Robinson, E. S. J., & Munafo, M. R. (2013). Power failure: Why small sample size undermines the reliability of neuroscience. Nature Reviews. Neuroscience, 14(5), 365–376. https://doi.org/10.1038/nrn3475
- Cohen, J. (1992). A power primer. Psychological Bulletin, 112(1), 155–159. https://doi.org/10.1037/0033-2909.112.1.155
- Dienlin, T., & Metzger, M. J. (2016). An extended privacy calculus model for SNSs—Analyzing self-disclosure and self-withdrawal in a representative U.S. sample. Journal of Computer-Mediated Communication, 21(5), 368–383. https://doi.org/10.1111/jcc4.12163
- Gelman, A. (2017). Poisoning the well with a within-person design? What's the risk? Retrieved from https://statmodeling.stat.columbia.edu/2017/11/25/poisoning-well-within-person-design-whats-risk/
- Lakens, D., Adolfi, F. G., Albers, C. J., Anvari, F., Apps, M. A. J., Argamon, S. E., … Zwaan, R. A. (2017). Justify your alpha: A response to Redefine Statistical Significance.
- Lakens, D., Scheel, A. M., & Isager, P. M. (2018). Equivalence testing for psychological research: A tutorial. Advances in Methods and Practices in Psychological Science, 1(2), 259–269. https://doi.org/10.1177/2515245918770963
- Rains, S. A., Levine, T. R. & Weber, R. (2018). Sixty years of quantitative communication research summarized: Lessons from 149 meta-analyses. Annals of the International Communication Association, 42(2), 105-124, https://doi.org/10.1080/23808985.2018.1446350
- Rouder, J. N., Morey, R. D., Verhagen, J., Province, J. M., & Wagenmakers, E.-J. (2016). Is there a free lunch in inference? Topics in Cognitive Science, 8(3), 520–547. https://doi.org/10.1111/tops.12214
Acknowledgements
Thanks go out to Niklas, Philipp, Romy, and Sabine who all provided valuable feedback to this blog post! In general, I'm always happy to get feedback. So if you've spotted something that's false or if you have further recommendations, please let me know.
Social Media
Footnotes
- For more technical explanations of power, see: Why you should think of statistical power as a curve by psychbrief, How a power analysis implicitly reveals the smallest effect size you care about by Daniel Lakens, or A power primer by Jacob Cohen.
- See, for example, Laken's excellent mooc Improving your statistical inferences).
- For simplicity's sake, I am sticking with standardized effects throughout this blog. I know that unstandardized effects would be preferable, but it is a bit easier both from a didactical and data-simulation perspective.
- Bear in mind that a nonsignificant result in frequentist null hypothesis testing, which is what we have done here, can never actually support the null hypothesis. To draw such an inference, we would need to use a different approach; e.g., equivalence testing or Bayesian statistics.
-
Note that for more complex analyses such as multilevel modelling, it is preferable to conduct power analyses using data simulations. For this, you can use packages/functions such as
lavaan::simulateData,psych::sim.multilevel,simsem,simstudy, or Lisa DeBruine'sfaux. - Similar to the alpha error, it is an even better idea to also specifically justify one's power depending on what is at stake. For starters, it is sensible to balance one's alpha and beta errors; Rouder et al., 2016.